
Fraud Detection and Prevention Market, By Solution (Fraud Analytics, Authentication, GRC), Vertical (BFSI, Retail, Healthcare, Real Estate, Manufacturing), Application, Service, and Organization Size, – Global Opportunity Analysis & Forecast to 2025.
Industry: Information & Communications Technology | Report Pages: 211 | List of Tables: 176 | List of Figures: 75 | Format :
Published Date: December 2018

PowerPoint Format

Data Analysis Sheet

PDF Format
Healthcare IT Market
The healthcare IT market was valued at USD 106.47 billion in 2017 and is projected to grow at a CAGR of over 18.68% from 2018 to 2025. The major key drivers include government initiatives and incentive programmes for the developments of healthcare IT market ecosystem, increase in medical tourism, use of healthcare IT products and services by the insurance companies, and adoption of cloud-based software.
The segments considered for this report are based on the solutions and outsourcing services, components, deployment, application, and regions. The solutions include provider & payer, and outsourcing services. The segmentation based on application consists of healthcare providers, healthcare payers, and others. The final segment—region—comprises North America, Europe, Asia-Pacific, and Rest of the World (RoW).
Apart from different applications, the market for payer solutions type is expected to grow at the highest CAGR between 2018 and 2025. The organization linked with the healthcare sector, such as health insurer have also turned digital due to the digitization of healthcare; this digital shift generated the demand from the healthcare payers. Various services, such as pharmacy audit, claims management, fraud management, population health management, and others are used by the healthcare payers widely across the globe.
The providers market accounts for the largest share in the healthcare IT market. The providers' segment is also expected to grow at a significant rate during the forecast period. This is primarily due to the governments, such as the USA’s promotion of healthcare IT among the providers by means of attractive incentives to maintain healthcare IT infrastructure.
Apart from various regions, North America is expected to hold the largest share of the healthcare IT market, which accounted for 47.37% in 2017. A high rate of deployment of these devices in the countries such as the USA, Canada, and Mexico is anticipated to contribute to the highest CAGR. However, Asia-Pacific showed the highest CAGR of 21.09% in terms of value, during the forecast period.
Key companies covered as a part of this study include Optum, Cerner, Cognizant, Philips, Epic Systems, Leidos, GE Healthcare, Conduent, Athenahealth, and Allscripts. These companies use strategies, such as acquisitions, expansions & investments, and new technology inventions to strengthen their position in the market.
Fig.1 Global Healthcare IT Market Size Analysis & Forecast, 2018-2025 (USD Billion)
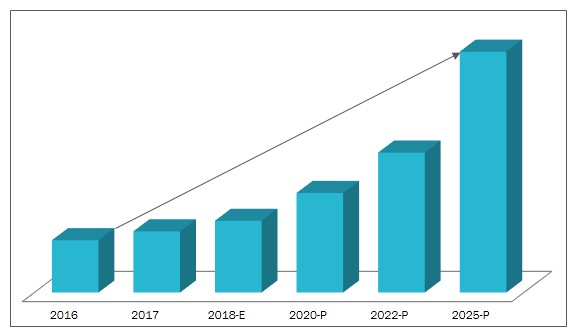
e-Estimated and p-Projected
Sources: Converged Markets Analysis
Key companies covered as a part of this study include Optum, Cerner, Cognizant, Philips, Epic Systems, Leidos, GE Healthcare, Conduent, Athenahealth, and Allscripts. These companies use strategies, such as acquisitions, expansions & investments, and new technology inventions to strengthen their position in the market.
The scope of the Study
The global healthcare IT market is segmented by solutions & outsourcing services, components, deployment, application, and region.
1. By Solution & Service
1) Provider Solutions
2) Payer Solutions
3) Outsourcing Services
2. By Component
1) Services
2) Software
3) Hardware
3. By Deployment
1) On-Cloud
2) On-Premises
4. By Application
1) Healthcare Providers
2) Healthcare Payers
3) Others
5. By Region
1) North America
i. USA
ii. Canada
iii. Mexico
2) Europe
i. Germany
ii. UK
iii. Italy
iv. Rest of Europe
3) Asia-Pacific
i. China
ii. India
iii. Japan
iv. Rest of Asia-Pacific
4) RoW
i. South America
ii. Middle East & Africa
1 INTRODUCTION
1.1 KEY RESEARCH OBJECTIVES
1.2 MARKET DEFINITION
1.3 REPORT SCOPE
1.3.1 SEGMENTAL SCOPE
1.3.2 REGIONAL SCOPE
1.4 CURRENCY CONVERSION
1.5 RESEARCH METHODOLOGY
1.5.1 MARKET SIZE ESTIMATION & DATA TRIANGULATION
1.5.2 KEY SOURCES
1.5.3 RESEARCH ASSUMPTIONS & LIMITATIONS
2 EXECUTIVE SUMMARY
2.1 OVERVIEW
2.2 HEALTHCARE IT MARKET SIZE, BY REGION, 2017 (USD BILLION)
2.3 HEALTHCARE IT MARKET: BY SOLUTION AND SERVICE
2.4 HEALTHCARE IT MARKET: BY COMPONENT
2.5 HEALTHCARE IT MARKET: BY DEPLOYMENT
2.6 HEALTHCARE IT MARKET: BY APPLICATION
2.7 ASIA-PACIFIC IS THE FASTEST GROWING REGION
2.8 KEY STRATEGIC DEVELOPMENTS
2.9 COMPETITIVE ANALYSIS OF KEY PLAYERS
2.10 COMPANY SHARE ANALYSIS
3 INDUSTRY ANALYSIS
3.1 PORTER’S FIVE FORCES MODEL
3.1.1 DEGREE OF COMPETITION
3.1.2 BARGAINING POWER OF SUPPLIERS
3.1.3 BARGAINING POWER OF BUYERS
3.1.4 THREAT OF SUBSTITUTES
3.1.5 THREAT OF NEW ENTRANTS
3.2 SUPPLY CHAIN ANALYSIS
3.3 REGULATIONS
3.3.1 USA
3.3.1.1 MARCA
3.3.1.2 HITECH
3.3.1.3 HIPAA
3.3.1.4 CMS
3.3.1.5 Federal Anti-Kickback Statute
3.3.1.6 False Claims Act
3.3.2 EUROPE
3.3.2.1 GDPR
3.3.3 INDIA
4 MARKET OVERVIEW
4.1 MARKET DYNAMICS
4.1.1 FACTOR ANALYSIS
4.1.1.1 Introduction
4.1.1.2 Demand Side Analysis
4.1.1.3 Supply Side Analysis
4.1.2 DRIVERS
4.1.2.1 Increasing Chronic Diseases
4.1.2.2 Advantages of Healthcare IT
4.1.2.3 Rising Need for Integrated Healthcare
4.1.2.4 Impact of Regulations in USA on Healthcare IT Market
4.1.3 BARRIER
4.1.3.1 Stringent Regulations and Compliances
4.1.4 OPPORTUNITY
4.1.4.1 Advancements in Technology
4.1.5 CHALLENGES
4.1.5.1 High Expenditure Needed to Set-Up IT Infrastructure
4.1.5.2 Increasing Security Breaches and Cyber Threats
5 HEALTHCARE IT MARKET, BY SOLUTION AND SERVICE
5.1 INTRODUCTION
5.2 PROVIDER SOLUTIONS
5.3 PAYER SOLUTIONS
5.4 OUTSOURCING SERVICES
6 HEALTHCARE IT MARKET, BY COMPONENT
6.1 INTRODUCTION
6.2 SERVICES
6.3 SOFTWARE
6.4 HARDWARE
7 HEALTHCARE IT MARKET, BY DEPLOYMENT
7.1 INTRODUCTION
7.2 ON-CLOUD
7.3 ON-PREMISES
8 HEALTHCARE IT MARKET, BY APPLICATION
8.1 INTRODUCTION
8.2 HEALTHCARE PROVIDERS
8.3 HEALTHCARE PAYERS
8.4 OTHERS
9 HEALTHCARE IT MARKET, BY REGION
9.1 INTRODUCTION
9.2 NORTH AMERICA
9.2.1 BY COUNTRY
9.2.2 BY COMPONENT
9.2.3 BY DEPLOYMENT
9.2.4 BY APPLICATION
9.2.5 KEY COUNTRY-WISE INSIGHTS
9.2.5.1 USA
9.2.5.1.1 By Solution and Service
9.2.5.1.2 By Component
9.2.5.1.3 By Deployment
9.2.5.1.4 By Application
9.2.5.2 Canada
9.2.5.2.1 By Solution and Service
9.2.5.2.2 By Component
9.2.5.2.3 By Deployment
9.2.5.2.4 By Application
9.2.5.3 Mexico
9.2.5.3.1 By Solution and Service
9.2.5.3.2 By Component
9.2.5.3.3 By Deployment
9.2.5.3.4 By Application
9.3 EUROPE
9.3.1 BY COUNTRY
9.3.2 BY COMPONENT
9.3.3 BY DEPLOYMENT
9.3.4 BY APPLICATION
9.3.5 KEY COUNTRY-WISE INSIGHTS
9.3.5.1 UK
9.3.5.1.1 By Solution and Service
9.3.5.1.2 By Component
9.3.5.1.3 By Deployment
9.3.5.1.4 By Application
9.3.5.2 Germany
9.3.5.2.1 By Solution and Service
9.3.5.2.2 By Component
9.3.5.2.3 By Deployment
9.3.5.2.4 By Application
9.3.5.3 Italy
9.3.5.3.1 By Solution and Service
9.3.5.3.2 By Component
9.3.5.3.3 By Deployment
9.3.5.3.4 By Application
9.3.5.4 Rest of Europe
9.3.5.4.1 By Solution and Service
9.3.5.4.2 By Component
9.3.5.4.3 By Deployment
9.3.5.4.4 By Application
9.4 ASIA-PACIFIC
9.4.1 BY COUNTRY
9.4.2 BY DEPLOYMENT
9.4.3 BY APPLICATION
9.4.4 KEY COUNTRY-WISE INSIGHTS
9.4.4.1 China
9.4.4.1.1 By Solution and Service
9.4.4.1.2 By Component
9.4.4.1.3 By Deployment
9.4.4.1.4 By Application
9.4.4.2 Japan
9.4.4.2.1 By Solution and Service
9.4.4.2.2 By Component
9.4.4.2.3 By Deployment
9.4.4.2.4 By Application
9.4.4.3 India
9.4.4.3.1 By Solution and Service
9.4.4.3.2 By Component
9.4.4.3.3 By Deployment
9.4.4.3.4 By Application
9.4.4.4 Rest of Asia-Pacific
9.4.4.4.1 By Solution and Service
9.4.4.4.2 By Component
9.4.4.4.3 By Deployment
9.4.4.4.4 By Application
9.5 ROW
9.5.1 BY COUNTRY
9.5.2 BY COMPONENT
9.5.3 BY DEPLOYMENT
9.5.4 BY APPLICATION
9.5.5 KEY COUNTRY-WISE INSIGHTS
9.5.5.1 Middle East & Africa
9.5.5.1.1 By Solution and Service
9.5.5.1.2 By Component
9.5.5.1.3 By Deployment
9.5.5.1.4 By Application
9.5.5.2 South America
9.5.5.2.1 By Solution and Service
9.5.5.2.2 By Component
9.5.5.2.3 By Deployment
9.5.5.2.4 By Application
10 COMPETITIVE LANDSCAPE
10.1 INTRODUCTION
10.2 COMPANY SHARE ANALYSIS
10.3 COMPETITIVE MATRIX
10.4 KEY STRATEGIC DEVELOPMENTS
10.4.1 OVERVIEW
10.4.2 BUSINESS STRATEGIES
10.4.3 PRODUCT OFFERINGS
11 COMPANY PROFILES
11.1 INTRODUCTION
11.2 OPTUM
11.2.1 BUSINESS OVERVIEW
11.2.2 OPTUM: SWOT ANALYSIS
11.2.3 CONVERGED MARKETS' VIEW
11.3 CERNER
11.3.1 BUSINESS OVERVIEW
11.3.2 CERNER: SWOT ANALYSIS
11.3.3 CONVERGED MARKETS' VIEW
11.4 PHILIPS
11.4.1 BUSINESS OVERVIEW
11.4.2 PHILIPS: SWOT ANALYSIS
11.4.3 CONVERGED MARKETS' VIEW
11.5 EPIC SYSTEMS CORPORATION
11.5.1 BUSINESS OVERVIEW
11.5.2 EPIC SYSTEMS: SWOT ANALYSIS
11.5.3 CONVERGED MARKETS' VIEW
11.6 ALLSCRIPTS
11.6.1 BUSINESS OVERVIEW
11.6.2 ALLSCRIPTS: SWOT ANALYSIS
11.6.3 CONVERGED MARKETS' VIEW
11.7 ATHENAHEALTH
11.7.1 BUSINESS OVERVIEW
11.7.2 CONVERGED MARKETS' VIEW
11.8 GE HEALTHCARE
11.8.1 BUSINESS OVERVIEW
11.8.2 CONVERGED MARKETS' VIEW
11.9 COGNIZANT TECHNOLOGY SOLUTIONS
11.9.1 BUSINESS OVERVIEW
11.9.2 CONVERGED MARKETS' VIEW
11.10 CONDUENT
11.10.1 BUSINESS OVERVIEW
11.10.2 CONVERGED MARKETS' VIEW
11.11 LEIDOS
11.11.1 BUSINESS OVERVIEW
11.11.2 CONVERGED MARKETS' VIEW
12 APPENDIX
12.1 DISCUSSION GUIDE
12.2 AVAILABLE CUSTOMIZATIONS
12.3 RELATED REPORTS
LIST OF TABLES
TABLE 1 KEY SECONDARY SOURCES
TABLE 2 KEY PRIMARY SOURCES
TABLE 3 ASSUMPTIONS
TABLE 4 LIMITATIONS
TABLE 5 HEALTHCARE IT MARKET DRIVERS, BARRIERS, OPPORTUNITIES, & CHALLENGES
TABLE 6 HEALTHCARE IT MARKET, BY SOLUTION AND SERVICE, 2016–2025 (USD BILLION)
TABLE 7 HEALTHCARE IT PROVIDER SOLUTIONS MARKET, BY REGION, 2016-2025 (USD BILLION)
TABLE 8 HEALTHCARE IT PAYER SOLUTIONS MARKET, BY REGION, 2016-2025 (USD BILLION)
TABLE 9 HEALTHCARE IT OUTSOURCING SERVICES MARKET, BY REGION, 2016-2025 (USD BILLION)
TABLE 10 HEALTHCARE IT MARKET, BY COMPONENT, 2016–2025 (USD BILLION)
TABLE 11 COMPONENT: HEALTHCARE IT SERVICES MARKET, BY REGION, 2016-2025 (USD BILLION)
TABLE 12 COMPONENT: HEALTHCARE IT SOFTWARE MARKET, BY REGION, 2016-2025 (USD BILLION)
TABLE 13 COMPONENT: HEALTHCARE IT HARDWARE MARKET, BY REGION, 2016-2025 (USD BILLION)
TABLE 14 HEALTHCARE IT MARKET, BY DEPLOYMENT, 2016–2025 (USD BILLION)
TABLE 15 ON-CLOUD: HEALTHCARE IT MARKET, BY REGION, 2016-2025 (USD BILLION)
TABLE 16 ON-PREMISES MODE: HEALTHCARE IT MARKET, BY REGION, 2016-2025 (USD BILLION)
TABLE 17 HEALTHCARE IT MARKET, BY APPLICATION, 2016–2025 (USD BILLION)
TABLE 18 HEALTHCARE IT: PROVIDERS MARKET, BY REGION, 2016-2025 (USD BILLION)
TABLE 19 HEALTHCARE IT : PAYERS MARKET, BY REGION, 2016-2025 (USD BILLION)
TABLE 20 HEALTHCARE IT: OTHERS MARKET, BY REGION, 2016-2025 (USD BILLION)
TABLE 21 HEALTHCARE IT MARKET, BY REGION, 2016-2025 (USD BILLION)
TABLE 22 NORTH AMERICA HEALTHCARE IT MARKET, BY COUNTRY, 2016-2025 (USD BILLION)
TABLE 23 NORTH AMERICA HEALTHCARE IT MARKET, BY SOLUTION AND SERVICE, 2016-2025 (USD BILLION)
TABLE 24 NORTH AMERICA HEALTHCARE IT MARKET, BY COMPONENT, 2016-2025 (USD BILLION)
TABLE 25 NORTH AMERICA HEALTHCARE IT MARKET, BY DEPLOYMENT, 2016-2025 (USD BILLION)
TABLE 26 NORTH AMERICA HEALTHCARE IT MARKET, BY APPLICATION, 2016-2025 (USD BILLION)
TABLE 27 USA HEALTHCARE IT MARKET, BY SOLUTION AND SERVICE, 2016-2025 (USD BILLION)
TABLE 28 USA HEALTHCARE IT MARKET, BY COMPONENT, 2016-2025 (USD BILLION)
TABLE 29 USA HEALTHCARE IT MARKET, BY DEPLOYMENT, 2016-2025 (USD BILLION)
TABLE 30 USA HEALTHCARE IT MARKET, BY APPLICATION, 2016-2025 (USD BILLION)
TABLE 31 CANADA HEALTHCARE IT MARKET, BY SOLUTION AND SERVICE, 2016-2025 (USD BILLION)
TABLE 32 CANADA HEALTHCARE IT MARKET, BY COMPONENT, 2016-2025 (USD BILLION)
TABLE 33 CANADA HEALTHCARE IT MARKET, BY DEPLOYMENT, 2016-2025 (USD BILLION)
TABLE 34 CANADA HEALTHCARE IT MARKET, BY APPLICATION, 2016-2025 (USD BILLION)
TABLE 35 MEXICO HEALTHCARE IT MARKET, BY SOLUTION AND SERVICE, 2016-2025 (USD BILLION)
TABLE 36 MEXICO HEALTHCARE IT MARKET, BY COMPONENT, 2016-2025 (USD BILLION)
TABLE 37 MEXICO HEALTHCARE IT MARKET, BY DEPLOYMENT, 2016-2025 (USD BILLION)
TABLE 38 MEXICO HEALTHCARE IT MARKET, BY APPLICATION, 2016-2025 (USD BILLION)
TABLE 39 EUROPE HEALTHCARE IT MARKET, BY COUNTRY, 2016-2025 (USD BILLION)
TABLE 40 EUROPE HEALTHCARE IT MARKET, BY SOLUTION AND SERVICE, 2016-2025 (USD BILLION)
TABLE 41 EUROPE HEALTHCARE IT MARKET, BY COMPONENT , 2016-2025 (USD BILLION)
TABLE 42 EUROPE HEALTHCARE IT MARKET, BY DEPLOYMENT, 2016-2025 (USD BILLION)
TABLE 43 EUROPE HEALTHCARE IT MARKET, BY APPLICATION, 2016-2025 (USD BILLION)
TABLE 44 UK HEALTHCARE IT MARKET, BY SOLUTION AND SERVICE, 2016-2025 (USD BILLION)
TABLE 45 UK HEALTHCARE IT MARKET, BY COMPONENT, 2016-2025 (USD BILLION)
TABLE 46 UK HEALTHCARE IT MARKET, BY DEPLOYMENT, 2016-2025 (USD BILLION)
TABLE 47 UK HEALTHCARE IT MARKET, BY APPLICATION, 2016-2025 (USD BILLION)
TABLE 48 GERMANY HEALTHCARE IT MARKET, BY SOLUTION AND SERVICE, 2016-2025 (USD BILLION)
TABLE 49 GERMANY HEALTHCARE IT MARKET, BY COMPONENT, 2016-2025 (USD BILLION)
TABLE 50 GERMANY HEALTHCARE IT MARKET, BY DEPLOYMENT, 2016-2025 (USD BILLION)
TABLE 51 GERMANY HEALTHCARE IT MARKET, BY APPLICATION, 2016-2025 (USD BILLION)
TABLE 52 ITALY HEALTHCARE IT MARKET, BY SOLUTION AND SERVICE, 2016-2025 (USD BILLION)
TABLE 53 ITALY HEALTHCARE IT MARKET, BY COMPONENT, 2016-2025 (USD BILLION)
TABLE 54 ITALY HEALTHCARE IT MARKET, BY DEPLOYMENT, 2016-2025 (USD BILLION)
TABLE 55 ITALY HEALTHCARE IT MARKET, BY APPLICATION, 2016-2025 (USD BILLION)
TABLE 56 REST OF EUROPE HEALTHCARE IT MARKET, BY SOLUTION AND SERVICE, 2016-2025 (USD BILLION)
TABLE 57 REST OF EUROPE HEALTHCARE IT MARKET, BY COMPONENT, 2016-2025 (USD BILLION)
TABLE 58 REST OF EUROPE HEALTHCARE IT MARKET, BY DEPLOYMENT, 2016-2025 (USD BILLION)
TABLE 59 REST OF EUROPE HEALTHCARE IT MARKET, BY APPLICATION, 2016-2025 (USD BILLION)
TABLE 60 ASIA-PACIFIC HEALTHCARE IT MARKET, BY COUNTRY, 2016-2025 (USD BILLION)
TABLE 61 ASIA-PACIFIC HEALTHCARE IT MARKET, BY SOLUTION AND SERVICE, 2016-2025 (USD BILLION)
TABLE 62 ASIA-PACIFIC HEALTHCARE IT MARKET, BY COMPONENT, 2016-2025 (USD BILLION)
TABLE 63 ASIA-PACIFIC HEALTHCARE IT MARKET, BY DEPLOYMENT, 2016-2025 (USD BILLION)
TABLE 64 ASIA-PACIFIC HEALTHCARE IT MARKET, BY APPLICATION, 2016-2025 (USD BILLION)
TABLE 65 CHINA HEALTHCARE IT MARKET, BY SOLUTION AND SERVICE, 2016-2025 (USD BILLION)
TABLE 66 CHINA HEALTHCARE IT MARKET, BY COMPONENT, 2016-2025 (USD BILLION)
TABLE 67 CHINA HEALTHCARE IT MARKET, BY DEPLOYMENT, 2016-2025 (USD BILLION)
TABLE 68 CHINA HEALTHCARE IT MARKET, BY APPLICATION, 2016-2025 (USD BILLION)
TABLE 69 JAPAN HEALTHCARE IT MARKET, BY SOLUTION AND SERVICE, 2016-2025 (USD BILLION)
TABLE 70 JAPAN HEALTHCARE IT MARKET, BY COMPONENT, 2016-2025 (USD BILLION)
TABLE 71 JAPAN HEALTHCARE IT MARKET, BY DEPLOYMENT, 2016-2025 (USD BILLION)
TABLE 72 JAPAN HEALTHCARE IT MARKET, BY APPLICATION, 2016-2025 (USD BILLION)
TABLE 73 INDIA HEALTHCARE IT MARKET, BY SOLUTION AND SERVICE, 2016-2025 (USD BILLION)
TABLE 74 INDIA HEALTHCARE IT MARKET, BY COMPONENT, 2016-2025 (USD BILLION)
TABLE 75 INDIA HEALTHCARE IT MARKET, BY DEPLOYMENT, 2016-2025 (USD BILLION)
TABLE 76 INDIA HEALTHCARE IT MARKET, BY APPLICATION, 2016-2025 (USD BILLION)
TABLE 77 REST OF ASIA-PACIFIC HEALTHCARE IT MARKET, BY SOLUTION AND SERVICE, 2016-2025 (USD BILLION)
TABLE 78 REST OF ASIA-PACIFIC HEALTHCARE IT MARKET, BY COMPONENT, 2016-2025 (USD BILLION)
TABLE 79 REST OF ASIA-PACIFIC HEALTHCARE IT MARKET, BY DEPLOYMENT, 2016-2025 (USD BILLION)
TABLE 80 REST OF ASIA-PACIFIC HEALTHCARE IT MARKET, BY APPLICATION, 2016-2025 (USD BILLION)
TABLE 81 ROW HEALTHCARE IT MARKET, BY COUNTRY, 2016-2025 (USD BILLION)
TABLE 82 ROW HEALTHCARE IT MARKET, BY SOLUTION AND SERVICE, 2016-2025 (USD BILLION)
TABLE 83 ROW HEALTHCARE IT MARKET, BY COMPONENT, 2016-2025 (USD BILLION)
TABLE 84 ROW HEALTHCARE IT MARKET, BY DEPLOYMENT, 2016-2025 (USD BILLION)
TABLE 85 ROW HEALTHCARE IT MARKET, BY APPLICATION, 2016-2025 (USD BILLION)
TABLE 86 MIDDLE EAST & AFRICA HEALTHCARE IT MARKET, BY SOLUTION AND SERVICE, 2016-2025 (USD BILLION)
TABLE 87 MIDDLE EAST & AFRICA HEALTHCARE IT MARKET, BY COMPONENT, 2016-2025 (USD BILLION)
TABLE 88 MIDDLE EAST & AFRICA HEALTHCARE IT MARKET, BYDEPLOYMENT, 2016-2025 (USD BILLION)
TABLE 89 MIDDLE EAST & AFRICA HEALTHCARE IT MARKET, BY APPLICATION, 2016-2025 (USD BILLION)
TABLE 90 SOUTH AMERICA HEALTHCARE IT MARKET, BY SOLUTION AND SERVICE, 2016-2025 (USD BILLION)
TABLE 91 SOUTH AMERICA HEALTHCARE IT MARKET, BY COMPONENT, 2016-2025 (USD BILLION)
TABLE 92 SOUTH AMERICA HEALTHCARE IT MARKET, BY DEPLOYMENT, 2016-2025 (USD BILLION)
TABLE 93 SOUTH AMERICA HEALTHCARE IT MARKET, BY APPLICATION, 2016-2025 (USD BILLION)
TABLE 94 ACQUISITIONS
TABLE 95 NEW PRODUCT DEVELOPMENTS
TABLE 96 EXPANSIONS & INVESTMENTS
TABLE 97 AGREEMENTS, COLLABORATIONS, AND PARTNERSHIPS
TABLE 98 OPTUM: PRODUCTS & SERVICES OFFERED
TABLE 99 OPTUM: KEY STRATEGIC DEVELOPMENTS
TABLE 100 CERNER: PRODUCTS & SERVICES OFFERED
TABLE 101 CERNER: KEY STRATEGIC DEVELOPMENTS
TABLE 102 PHILIPS: PRODUCTS & SERVICES OFFERED
TABLE 103 PHILIPS: KEY STRATEGIC DEVELOPMENTS
TABLE 104 EPIC SYSTEMS: PRODUCTS & SERVICES OFFERED
TABLE 105 EPIC SYSTEMS: KEY STRATEGIC DEVELOPMENTS
TABLE 106 ALLSCRIPTS: PRODUCTS & SERVICES OFFERED
TABLE 107 ALLSCRIPTS: KEY STRATEGIC DEVELOPMENTS
TABLE 108 ATHENAHEALTH: PRODUCTS & SERVICES OFFERED
TABLE 109 ATHENAHEALTH: KEY STRATEGIC DEVELOPMENTS
TABLE 110 GE HEALTHCARE: PRODUCTS & SERVICES OFFERED
TABLE 111 GE HEALTHCARE: KEY STRATEGIC DEVELOPMENTS
TABLE 112 COGNIZANT: PRODUCTS & SERVICES OFFERED
TABLE 113 COGNIZANT: KEY STRATEGIC DEVELOPMENTS
TABLE 114 CONDUENT: PRODUCTS & SERVICES OFFERED
TABLE 115 CONDUENT: KEY STRATEGIC DEVELOPMENTS
TABLE 116 LEIDOS : PRODUCTS & SERVICES OFFERED
TABLE 117 LEIDOS: KEY STRATEGIC DEVELOPMENTS
LIST OF FIGURES
FIGURE 1 SEGMENTAL SCOPE
FIGURE 2 REGIONAL SCOPE
FIGURE 3 HEALTHCARE IT MARKET: RESEARCH DESIGN
FIGURE 4 MARKET SIZE ESTIMATION METHODOLOGY: TOP DOWN & BOTTOM UP APPROACH
FIGURE 5 NORTH AMERICA HELD LARGEST SHARE IN HEALTHCARE IT MARKET IN 2017
FIGURE 6 PROVIDER SOLUTIONS HELD LARGEST MARKET SHARE IN 2017
FIGURE 7 SERVICES SEGMENT DOMINATED HEALTHCARE IT MARKET IN 2017
FIGURE 8 ON-CLOUD SEGMENT TO WITNESS HIGHEST GROWTH RATE DURING FORECAST PERIOD
FIGURE 9 WIDE ADOPTION OF ELECTRONIC HEALTH RECORD LED HEALTHCARE PROVIDERS MARKET IN 2017
FIGURE 10 DEMAND FROM DEVELOPING COUNTRIES & GOVERNMENT SUPPORT DRIVES GROWTH IN ASIA-PACIFIC
FIGURE 11 TECHNOLOGY ADOPTION RESULTED IN HIGHEST GROWTH IN ASIA-PACIFIC IN 2017
FIGURE 12 COLLABORATIONS & AGREEMENTS OCCUPIED HIGHEST SHARE IN HEALTHCARE IT MARKET
FIGURE 13 OPTUM AND COGNIZANT ARE PIONEERS WITH LARGE CUSTOMER BASE & BALANCED BUSINESS STRATEGIES IN HEALTHCARE IT MARKET
FIGURE 14 MAJOR INDUSTRY PLAYERS FOLLOWED AGREEMENT & COLLABORATION STRATEGIES
FIGURE 15 PORTER’S FIVE FORCES ANALYSIS
FIGURE 16 HEALTHCARE IT MARKET:SUPPLY CHAIN ANALYSIS
FIGURE 17 INCREASING CHRONIC DISEASES IN USA
FIGURE 18 GROWING MIDDLE CLASS POPULATION FROM 2015 TO 2030
FIGURE 19 HEALTHCARE IT MARKET, BY SOLUTION AND SERVICE, 2016–2025 (USD BILLION)
FIGURE 20 HEALTHCARE IT MARKET, BY COMPONENT, 2016–2025 (USD BILLION)
FIGURE 21 HEALTHCARE IT MARKET, BY DEPLOYMENT, 2016–2025 (USD BILLION)
FIGURE 22 HEALTHCARE IT MARKET, BY APPLICATION, 2016–2025 (USD BILLION)
FIGURE 23 HEALTHCARE IT MARKET, BY REGION, 2017 (USD BILLION)
FIGURE 24 HEALTHCARE IT MARKET, BY REGION, 2016-2025 (USD BILLION)
FIGURE 25 NORTH AMERICA HEALTHCARE IT MARKET, COUNTRY SNAPSHOT, 2017
FIGURE 26 NORTH AMERICA HEALTHCARE IT MARKET, BY COUNTRY, 2016-2025 (USD BILLION)
FIGURE 27 NORTH AMERICA HEALTHCARE IT MARKET, BY SOLUTION AND SERVICE, 2016-2025 (USD BILLION)
FIGURE 28 NORTH AMERICA HEALTHCARE IT MARKET, BY COMPONENT, 2016-2025 (USD BILLION)
FIGURE 29 NORTH AMERICA HEALTHCARE IT MARKET, BY DEPLOYMENT, 2016-2025 (USD BILLION)
FIGURE 30 NORTH AMERICA HEALTHCARE IT MARKET, BY APPLICATION, 2016-2025 (USD BILLION)
FIGURE 31 EUROPE HEALTHCARE IT MARKET, BY COUNTRY, 2016-2025 (USD BILLION)
FIGURE 32 EUROPE HEALTHCARE IT MARKET, BY SOLUTION AND SERVICE, 2016-2025 (USD BILLION)
FIGURE 33 EUROPE HEALTHCARE IT MARKET, BY COMPONENT, 2016-2025 (USD BILLION)
FIGURE 34 EUROPE HEALTHCARE IT MARKET, BY DEPLOYMENT, 2016-2025 (USD BILLION)
FIGURE 35 EUROPE HEALTHCARE IT MARKET, BY APPLICATION, 2016-2025 (USD BILLION)
FIGURE 36 ASIA-PACIFIC HEALTHCARE IT MARKET, COUNTRY SNAPSHOT, 2017
FIGURE 37 ASIA-PACIFIC HEALTHCARE IT MARKET, BY COUNTRY, 2016-2025 (USD BILLION)
FIGURE 38 ASIA-PACIFIC HEALTHCARE IT MARKET, BY SOLUTION AND SERVICE, 2016-2025 (USD BILLION)
FIGURE 39 ASIA-PACIFIC HEALTHCARE IT MARKET, BY COMPONENT, 2016-2025 (USD BILLION)
FIGURE 40 ASIA-PACIFIC HEALTHCARE IT MARKET, BY DEPLOYMENT, 2016-2025 (USD BILLION)
FIGURE 41 ASIA-PACIFIC HEALTHCARE IT MARKET, BY APPLICATION, 2016-2025 (USD BILLION)
FIGURE 42 ROW HEALTHCARE IT MARKET, BY COUNTRY, 2016-2025 (USD BILLION)
FIGURE 43 ROW HEALTHCARE IT MARKET, BY SOLUTION AND SERVICE, 2016-2025 (USD BILLION)
FIGURE 44 ROW HEALTHCARE IT MARKET, BY COMPONENT, 2016-2025 (USD BILLION)
FIGURE 45 ROW HEALTHCARE IT MARKET, BY DEPLOYMENT, 2016-2025 (USD BILLION)
FIGURE 46 ROW HEALTHCARE IT MARKET, BY APPLICATION, 2016-2025 (USD BILLION)
FIGURE 47 HEALTHCARE IT MARKET OVERVIEW, 2016-2018
FIGURE 48 HEALTHCARE IT MARKET: COMPANY SHARE ANALYSIS, 2017
FIGURE 49 HEALTHCARE IT MARKET: COMPETITIVE MATRIX
FIGURE 50 HEALTHCARE IT MARKET: BUSINESS STRATEGIES
FIGURE 51 HEALTHCARE IT MARKET: PRODUCT AND SERVICE OFFERING
FIGURE 52 OPTUM: COMPANY OVERVIEW
FIGURE 53 OPTUM: SWOT ANALYSIS
FIGURE 54 CERNER: COMPANY OVERVIEW
FIGURE 55 CERNER: SWOT ANALYSIS
FIGURE 56 PHILIPS: COMPANY OVERVIEW
FIGURE 57 PHILIPS: SWOT ANALYSIS
FIGURE 58 EPIC SYSTEMS: BUSINESS OVERVIEW
FIGURE 59 EPIC SYSTEMS: SWOT ANALYSIS
FIGURE 60 ALLSCRIPTS: COMPANY OVERVIEW
FIGURE 61 ALLSCRIPTS: SWOT ANALYSIS
FIGURE 62 ATHENAHEALTH: COMPANY OVERVIEW
FIGURE 63 GE HEALTHCARE: COMPANY OVERVIEW
FIGURE 64 COGNIZANT: COMPANY OVERVIEW
FIGURE 65 CONDUENT: COMPANY OVERVIEW
FIGURE 66 LEIDOS: COMPANY OVERVIEW
The healthcare IT market was valued at USD 106.47 billion in 2017, and is projected to grow at a CAGR of over 18.68% from 2018 to 2025. The major key drivers for the growth of healthcare IT market are increase in chronic diseases, need for integrated healthcare services and solutions, healthcare tourism, and rapid development of healthcare infrastructure. The key restraining factors for the growth of the healthcare IT market are stringent regulations, and slow and fluctuating economic growth in countries, such as Europe and Asia-Pacific; these factors act as barriers
The healthcare providers market accounts for the largest share, and is expected to grow at a significant rate during the forecast period. This is primarily due to the governments, such as the USA promotes healthcare IT among the providers by means of attractive incentives to providers to maintain infrastructure.
The on-cloud segment accounted for the largest market share in 2017, which is expected to witness the highest CAGR, followed by on-premises. On-cloud is widely adopted by various healthcare providers as the health records can be accessed anywhere, and the cloud computing reduces the overall IT cost for the providers. Hence on-cloud segment is growing in the healthcare IT market.
The healthcare IT market, by application is classified into healthcare providers, healthcare payers, and others. The healthcare providers segment is currently the largest one due to the increased adoption of the healthcare IT infrastructure to maintain electronic health records. However, the healthcare payers segment is expected to witness the highest growth rate over the forecast period. This is due to the increased services for the healthcare payers, such as claims management services, which is widely used by the most insurance companies.
The healthcare IT components market is classified into services, software, and hardware. The healthcare IT component market was dominated by the service segment, and is projected to dominate till 2025. This is attributed to high usage of consultation services, such as clinical, consumer engagement, and business consulting from hospitals and pharmacies. The market for software segment is projected to witness the highest growth rate from 2018 to 2025, due to the increase in adoption of cloud-based software.
In the North America healthcare IT market, the USA held the largest share in 2017, due to presence of largest producer and consumer. The rate at which chronic diseases increase is also high in the USA, which generated the need for smart and effective healthcare system. Hence, the USA occupies the largest share in this market.
The market in India is projected to grow faster compared to any other country in the Asia-Pacific region. This is due to the increasing per capita income, growing health awareness among middle-class residents, and developing healthcare infrastructure. The Indian economy is projected to grow at a higher rate as compared to the ROW; this is expected to further fuel the healthcare IT market.
Fig.1 Global Healthcare IT Market Share, by Application, 2017 (%)
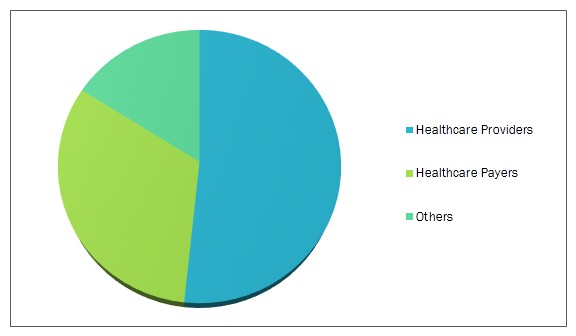
Source: Converged Markets Analysis
Key companies covered as a part of this study include, Optum, Cerner, Cognizant, Philips, Epic Systems, Leidos, GE Healthcare, Conduent, Athenahealth, and Allscripts. These companies use strategies such as acquisitions, expansions & investments, and new technology inventions to strengthen their position in the market. For instance, companies such as Optum, Conduent, and Epic systems focus on innovation and product portfolio that define their growth strategies.