
Managed Security Services Market by Type (Managed IAM, Managed Firewall, Managed DLP, Managed IDS/IPS, Managed Encryption, Managed SIEM, Managed UTM), Organization Size, Deployment, and Vertical- Global Opportunity Analysis & Forecast to 2025
Industry: Information & Communications Technology | Report Pages: 168 | List of Tables: 130 | List of Figures: 43 | Format :
Published Date: November 2018

PowerPoint Format

Data Analysis Sheet

PDF Format
Managed Security Services Market
Managed security services (MSS) include services offered by the providers to monitor and manage an organization's security requirements. The services are outsourced to a service provider that monitors the organization's security events, processes, security technology, and security-related databases in-house or remotely. These services are delivered through shared services from remote security operations centers (SOCs)
The market is expected to reach USD 73.95 billion by 2025, growing at a CAGR of 15.2% during the forecast period. The market is primarily driven by the factors such as rise in the number of sophisticated cyber threats, stringent government regulations, and lack of skilled security professionals in the organizations. However, unawareness about the cybersecurity amongst the organizations is a primary challenge ahead of the MSSPs
On the basis of type, identity & access management services segment held the largest market share in 2017. With the increase in cyber threats, mandatory compliance management, and trend of mobility has enabled organizations to adopt managed identity & access management services. The managed encryption segment is estimated to grow at the highest rate with the challenge of critical data loss in the on-premises environment and regulations.
The governments and businesses in the Asia-Pacific region face multiple cyber attacks. The rate of ransomware attacks increased up to 10 times from the last two years in this region. The growth in the number of cyber attacks is creating awareness and requirement to mitigate cyber threat in Asia-Pacific. Rise in such cyber crimes enabled the organizations to have holistic security approach and adopt managed security services across the region.
Figure 1. Managed Security Services Market Snapshot, 2018-2025 (%)
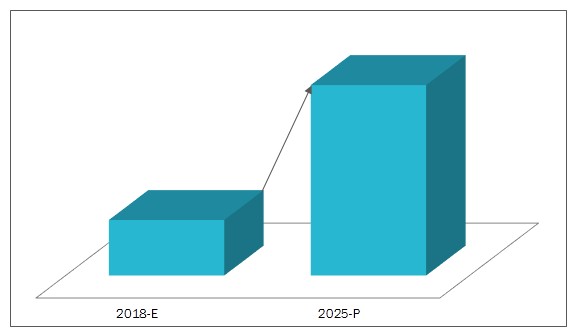
Sources: Secondary Research, Primary Interviews, and Converged Markets Analysis
Scope of the report
The managed security services market is segmented into type, organization size, deployment mode, vertical, and region. The report is further bifurcated as follows,
- By Type
- Managed Identity and Access Management
- Managed Antivirus/Anti-Malware
- Managed Firewall
- Managed Risk and Compliance Management
- Managed Vulnerability Management
- Managed Security Information and Event Management
- Managed Intrusion Detection System/Intrusion Prevention System (IDS/IPS)
- Managed Disaster Recovery
- Managed Unified Threat Management
- Managed Encryption
- Managed Data Loss Prevention
- Managed Distributed Denial of Service Mitigation
- Others
- By Organization
- Large enterprises
- SMEs
- By Deployment
- On-Premises
- On-Cloud
- By Region
- North America
- USA
- Canada
- Mexico
- Europe
- UK
- Germany
- Netherlands
- France
- Rest of the Europe
- Asia-Pacific
- China
- Japan
- India
- Australia
- Rest of Asia-Pacific
- Rest of the World
- Middle East &Africa
- South America
The report includes forecast, analysis, and discussion of important industry trends, market size, share estimates, and profiles of leading industry players. This report provides an in-depth study of key companies and competitive analysis of developments recorded in the industry in the last five years. In this report, market dynamics such driver, barriers, opportunities, challenges, and factor analysis are discussed in detail.
Companies such as IBM, SecureWorks, BT Group, AT&T, Verizon, Trustwave, Symantec, Wipro, AlertLogic, and CenturyLink are profiled to provide an insight into the competitive scenario of the global managed security services market.
1. INTRODUCTION
1.1 KEY RESEARCH OBJECTIVES
1.2 MARKET DEFINITION
1.3 REPORT SCOPE
1.3.1 SEGMENTAL SCOPE
1.4 REGIONAL SCOPE
1.5 CURRENCY & CONVERSION
1.6 RESEARCH METHODOLOGY
1.6.1 MARKET SIZE ESTIMATION & DATA TRIANGULATION
1.6.2 KEY SOURCES
1.6.3 RESEARCH ASSUMPTIONS & LIMITATIONS
2 EXECUTIVE SUMMARY
2.1 OVERVIEW
2.2 MANAGED SECURITY SERVICES MARKET: BY TYPE
2.3 MANAGED SECURITY SERVICES MARKET: BY VERTICAL
2.4 MANAGED SECURITY SERVICES MARTKET: BY ORGANIZATION
2.5 ASIA-PACIFIC IS THE FASTEST GROWING REGION
2.6 KEY STRATEGIC DEVELOPMENT
3 INDUSTRY ANALYSIS
3.1 PORTER’S FIVE FORCES MODEL
3.1.1 DEGREE OF COMPETITION
3.1.2 BARGAINING POWER OF SUPPLIERS
3.1.3 BARGAINING POWER OF BUYERS
3.1.4 THREAT OF SUBSTITUTES
3.1.5 THREAT OF NEW ENTRANTS
3.2 SUPPLY CHAIN ANALYSIS
3.3 REGULATIONS
3.3.1 NYDFS
3.3.2 HEALTH INSURANCE PORTABILITY AND ACCOUNTABILITY ACT (HIPAA)
3.3.3 PAYMENT CARD INDUSTRY DATA SECURITY STANDARD
3.3.4 GDPR (GENERAL DATA PROTECTION REGULATION)
3.3.5 GRAMM-LEACH-BLILEY ACT
3.3.6 SARBANES-OXLEY ACT
3.4 CASE STUDIES
4 MARKET OVERVIEW
4.1 MARKET DYNAMICS
4.1.1 FACTOR ANALYSIS
4.1.1.1 Introduction
4.1.1.2 Overview of Parent Industry
4.1.1.3 Demand Side Analysis
4.1.1.4 Urbanization and Economic Growth
4.1.1.5 National Security
4.1.1.6 Supply Side Analysis
4.1.1.7 Strong Competition and Substitute Markets
4.1.1.8 Need for Talented Employees
4.1.2 DRIVERS
4.1.2.1 Rise in Cyber Threats and Investment on Security Services by Organizations
4.1.2.2 Increase in Government Regulations
4.1.2.3 Lack of Skilled Security Professionals
4.1.3 BARRIER
4.1.3.1 Hesitation to Share Sensitive Data
4.1.4 OPPORTUNITIES
4.1.4.1 Need for IOT Security
4.1.4.2 Sharing of Threat Intelligence
4.1.5 CHALLENGE
4.1.5.1 Unawareness at The End-User Organizations
5 MANAGED SECURITY SERVICES MARKET, BY TYPE
5.1 INTRODUCTION
5.2 IDENTITY AND ACCESS MANAGEMENT
5.3 MANAGED ANTIVIRUS/ANTI-MALWARE
5.4 MANAGED FIREWALL
5.5 MANAGED RISK AND COMPLIANCE MANAGEMENT
5.6 MANAGED VULNERABILITY MANAGEMENT
5.7 MANAGED SECURITY INFORMATION AND EVENT MANAGEMENT
5.8 MANAGED INTRUSION DETECTION SYSTEM/INTRUSION PREVENTION SYSTEM (IDS/IPS)
5.9 MANAGED DISASTER RECOVERY
5.10 MANAGED UNIFIED THREAT MANAGEMENT
5.11 MANAGED ENCRYPTION
5.12 MANAGED DATA LOSS PREVENTION
5.13 MANAGED DISTRIBUTED DENIAL OF SERVICE MITIGATION
5.14 OTHERS
6 MANAGED SECURITY SERVICES MARKET, BY DEPLOYMENT
6.1 INTRODUCTION
6.2 ON-PREMISES
6.3 ON-CLOUD
7 MANAGED SECURITY SERVICES MARKET, BY ORGANIZATION
7.1 INTRODUCTION
7.2 LARGE ENTERPRISES
7.3 SMALL AND MEDIUM-SIZED ENTERPRISES
8 MANAGED SECURITY SERVICES MARKET, BY VERTICAL
8.1 INTRODUCTION
8.2 BANKING, FINANCIAL SERVICES, AND INSURANCE (BFSI)
8.3 GOVERNMENT AND DEFENSE
8.4 TELECOM AND IT
8.5 HEALTHCARE
8.6 ENERGY AND UTILITIES
8.7 MANUFACTURING
8.8 RETAIL
8.9 OTHERS
9 MANAGED SECURITY SERVICES MARKET, BY REGION
9.1 INTRODUCTION
9.2 NORTH AMERICA
9.2.1 BY COUNTRY
9.2.2 BY TYPE
9.2.3 BY ORGANIZATION SIZE
9.2.4 BY DEPLOYMENT
9.2.5 BY VERTICAL
9.2.6 KEY COUNTRY-WISE INSIGHTS
9.2.6.1 USA
9.2.6.1.1 By Organization Size
9.2.6.1.2 By Deployment
9.2.6.1.3 By Vertical
9.2.6.2 Canada
9.2.6.2.1 By Organization Size
9.2.6.2.2 By Deployment
9.2.6.2.3 By Vertical
9.2.6.3 Mexico
9.2.6.3.1 By Organization Size
9.2.6.3.2 By Deployment
9.2.6.3.3 By Vertical
9.3 EUROPE
9.3.1 BY COUNTRY
9.3.2 BY TYPE
9.3.3 BY ORGANIZATION SIZE
9.3.4 BY DEPLOYMENT
9.3.5 BY VERTICAL
9.3.6 KEY COUNTRY-WISE INSIGHTS
9.3.6.1 UK
9.3.6.1.1 By Organization Size
9.3.6.1.2 By Deployment
9.3.6.1.3 By Vertical
9.3.6.2 Germany
9.3.6.2.1 By Organization Size
9.3.6.2.2 By Deployment
9.3.6.2.3 By Vertical
9.3.6.3 The Netherlands
9.3.6.3.1 By Organization Size
9.3.6.3.2 By Deployment
9.3.6.3.3 By Vertical
9.3.6.4 France
9.3.6.4.1 By Organization Size
9.3.6.4.2 By Deployment
9.3.6.4.3 By Vertical
9.3.6.5 Rest of Europe
9.3.6.5.1 By Organization Size
9.3.6.5.2 By Deployment
9.3.6.5.3 By Vertical
9.4 ASIA-PACIFIC
9.4.1 BY COUNTRY
9.4.2 BY TYPE
9.4.3 BY ORGANIZATION SIZE
9.4.4 BY DEPLOYMENT
9.4.5 BY VERTICAL
9.4.6 KEY COUNTRY-WISE INSIGHTS
9.4.6.1 Australia
9.4.6.1.1 By Organization Size
9.4.6.1.2 By Deployment
9.4.6.1.3 By Vertical
9.4.6.2 Japan
9.4.6.2.1 By Organization Size
9.4.6.2.2 By Deployment
9.4.6.2.3 By Vertical
9.4.6.3 China
9.4.6.3.1 By Organization Size
9.4.6.3.2 By Deployment
9.4.6.3.3 By Vertical
9.4.6.4 India
9.4.6.4.1 By Organization Size
9.4.6.4.2 By Deployment
9.4.6.4.3 By Vertical
9.4.6.5 Rest of Asia-Pacific
9.4.6.5.1 By Organization Size
9.4.6.5.2 By Deployment
9.4.6.5.3 By Vertical
9.5 REST OF THE WORLD
9.5.1 BY REGION
9.5.2 BY TYPE
9.5.3 BY ORGANIZATION SIZE
9.5.4 BY DEPLOYMENT
9.5.5 BY VERTICAL
9.5.6 REGION-WISE INSIGHTS
9.5.6.1 Middle East & Africa
9.5.6.1.1 By Organization Size
9.5.6.1.2 By Deployment
9.5.6.1.3 By Vertical
9.5.6.2 South America
9.5.6.2.1 By Organization Size
9.5.6.2.2 By Deployment
9.5.6.2.3 By Vertical
10 COMPETITIVE LANDSCAPE
10.1 INTRODUCTION
10.1.1 COMPETITIVE MATRIX
10.2 COMPANY SHARE ANALYSIS, 2017
10.3 KEY STRATEGIC DEVELOPMENTS
10.3.1 OVERVIEW
10.3.2 PARTNERSHIPS AND COLLABORATIONS
10.3.3 ACQUISITIONS
10.3.4 EXPANSIONS
10.3.5 NEW PRODUCT DEVELOPMENTS
10.3.6 BUSINESS STRATEGIES
10.3.7 PRODUCT OFFERINGS
11 COMPANY PROFILES
11.1 INTRODUCTION
11.2 SECUREWORKS
11.2.1 BUSINESS OVERVIEW
11.2.2 SECUREWORKS: SWOT ANALYSIS
11.2.3 CONVERGED MARKETS’ VIEW
11.3 IBM
11.3.1 BUSINESS OVERVIEW
11.3.2 IBM:SWOT ANALYSIS
11.3.3 CONVERGED MARKETS’ VIEW
11.4 VERIZON
11.4.1 BUSINESS OVERVIEW
11.4.2 VERIZON: SWOT ANALYSIS
11.4.3 CONVERGED MARKETS’ VIEW
11.5 BT GROUP
11.5.1 BUSINESS OVERVIEW
11.5.2 BT: SWOT ANALYSIS
11.5.3 CONVERGED MARKETS’ VIEW
11.6 SYMANTEC
11.6.1 BUSINESS OVERVIEW
11.6.2 SYMANTEC: SWOT ANALYSIS
11.6.3 CONVERGED MARKETS’ VIEW
11.7 TRUSTWAVE
11.7.1 BUSINESS OVERVIEW
11.7.2 CONVERGED MARKETS’ VIEW
11.8 AT&T;
11.8.1 BUSINESS OVERVIEW
11.8.2 CONVERGED MARKETS’ VIEW
11.9 CENTURYLINK
11.9.1 BUSINESS OVERVIEW
11.9.2 CONVERGED MARKETS’ VIEW
11.10 WIPRO
11.10.1 BUSINESS OVERVIEW
11.10.2 CONVERGED MARKETS’ VIEW
11.11 ALERT LOGIC
11.11.1 BUSINESS OVERVIEW
11.11.2 CONVERGED MARKETS’ VIEW
12 APPENDIX
12.1 DISCUSSION GUIDE
12.2 AVAILABLE CUSTOMIZATIONS
12.3 RELATED REPORTS
LIST OF TABLES
TABLE 1 KEY SECONDARY SOURCES
TABLE 2 KEY PRIMARY SOURCES
TABLE 3 ASSUMPTIONS
TABLE 4 LIMITATIONS
TABLE 5 AIG KOREA ADOPTS MANAGED SECURITY SERVICES OF SYMANTEC TO ENHANCE SECURITY SUPPORT
TABLE 6 WILBUR ELLIS PROTECT THE FUTURE OF CULTIVATION BY ADOPTING MANAGED SECURITY SERVICES FOR AGRI BUSINESS
TABLE 7 THE NATIONWIDE ADOPTS BT MANAGED SECURITY SERVICES WHICH MAKES BANKING SAFER
TABLE 8 PAYMENT CARD INDUSTRY TAKES MANAGED SECURITY SERVICES FOR CYBER SECURITY
TABLE 9 LAKE AREA BANK FACED PHISHING ATTACK AND ADOPT MANAGED SECURITY SERVICES BY SECUREWORKS
TABLE 10 MANAGED SECURITY SERVICES MARKET, DRIVERS, BARRIERS, OPPORTUNITIES & CHALLENGES
TABLE 11 MANAGED SECURITY SERVICES MARKET, BY TYPE, 2016–2025 (USD BILLION)
TABLE 12 IDENTITY AND ACCESS MANAGEMENT MARKET, BY REGION, 2016-2025 (USD BILLION)
TABLE 13 MANAGED ANTIVIRUS/ANTI-MALWARE MARKET, BY REGION, 2016-2025 (USD BILLION)
TABLE 14 MANAGED FIREWALL MARKET, BY REGION, 2016-2025 (USD BILLION)
TABLE 15 MANAGED RISK AND COMPLIANCE MANAGEMENT MARKET, BY REGION, 2016-2025 (USD BILLION)
TABLE 16 MANAGED VULNERABILITY MANAGEMENT MARKET, BY REGION, 2016-2025 (USD BILLION)
TABLE 17 MANAGED SECURITY INFORMATION AND EVENT MANAGEMENT MARKET, BY REGION, 2016-2025 (USD BILLION)
TABLE 18 MANAGED INTRUSION DETECTION SYSTEM/INTRUSION PREVENTION SYSTEM MARKET, BY REGION, 2016-2025 (USD BILLION)
TABLE 19 MANAGED DISASTER RECOVERY MARKET, BY REGION, 2016-2025 (USD BILLION)
TABLE 20 MANAGED UNIFIED THREAT MANAGEMENT MARKET, BY REGION, 2016-2025 (USD BILLION)
TABLE 21 MANAGED ENCRYPTION MARKET, BY REGION, 2016-2025 (USD BILLION)
TABLE 22 MANAGED DATA LOSS PREVENTION MARKET, BY REGION, 2016-2025 (USD BILLION)
TABLE 23 MANAGED DISTRIBUTED DENIAL OF SERVICE MITIGATION MARKET, BY REGION, 2016-2025 (USD BILLION)
TABLE 24 OTHERS, BY REGION, 2016-2025 (USD BILLION)
TABLE 25 MANAGED SECURITY SERVICES, BY DEPLOYMENT, 2016–2025 (USD BILLION)
TABLE 26 ON-PREMISES: MANAGED SECURITY SERVICES MARKET, BY REGION, 2016-2025 (USD BILLION)
TABLE 27 ON-CLOUD: MANAGED SECURITY SERVICES MARKET, BY REGION, 2016-2025 (USD BILLION)
TABLE 28 MANAGED SECURITY SERVICES MARKET, BY ORGANIZATION SIZE, 2016–2025 (USD BILLION)
TABLE 29 LARGE ENTERPRISES: MANAGED SECURITY SERVICES MARKET, BY REGION, 2016-2025 (USD BILLION)
TABLE 30 SMES: MANAGED SECURITY SERVICES MARKET, BY REGION, 2016-2025 (USD BILLION)
TABLE 31 MANAGED SECURITY SERVICES MARKET, BY VERTICAL, 2016–2025 (USD BILLION)
TABLE 32 BFSI: MANAGED SECURITY SERVICES MARKET, BY REGION, 2016-2025 (USD BILLION)
TABLE 33 GOVERNMENT AND DEFENSE: MANAGED SECURITY SERVICES MARKET, BY REGION, 2016-2025 (USD BILLION)
TABLE 34 TELECOM AND IT: MANAGED SECURITY SERVICES MARKET, BY REGION, 2016-2025 (USD BILLION)
TABLE 35 HEALTHCARE: MANAGED SECURITY SERVICES MARKET, BY REGION, 2016-2025 (USD BILLION)
TABLE 36 ENERGY AND UTILITIES: MANAGED SECURITY SERVICES MARKET, BY REGION, 2016-2025 (USD BILLION)
TABLE 37 MANUFACTURING: MANAGED SECURITY SERVICES MARKET, BY REGION, 2016-2025 (USD BILLION)
TABLE 38 RETAIL: MANAGED SECURITY SERVICES MARKET, BY REGION, 2016-2025 (USD BILLION)
TABLE 39 OTHERS: MANAGED SECURITY SERVICES MARKET, BY REGION, 2016-2025 (USD BILLION)
TABLE 40 MANAGED SECURITY SERVICES MARKET, BY REGION, 2016-2025 (USD BILLION)
TABLE 41 NORTH AMERICA MANAGED SECURITY SERVICES MARKET, BY COUNTRY, 2016-2025 (USD BILLION)
TABLE 42 NORTH AMERICA MANAGED SECURITY SERVICES MARKET, BY COUNTRY, 2016-2025 (USD BILLION)
TABLE 43 NORTH AMERICA MANAGED SECURITY SERVICES MARKET, BY TYPE, 2016-2025 (USD BILLION)
TABLE 44 NORTH AMRICA MANAGED SECURITY SERVICES MARKET, BY ORGANIZATION SIZE, 2016-2025 (USD BILLION)
TABLE 45 NORTH AMERICA MANAGED SECURITY SERVICES MARKET, BY DEPLOYMENT, 2016-2025 (USD BILLION)
TABLE 46 NORTH AMERICA MANAGED SECURITY SERVICES MARKET, BY VERTICAL, 2016-2025 (USD BILLION)
TABLE 47 USA MANAGED SECURITY SERVICES MARKET, BY ORGANIZATION SIZE, 2016-2025 (USD BILLION)
TABLE 48 USA MANAGED SECURITY SERVICES MARKET, BY DEPLOYMENT, 2016-2025 (USD BILLION)
TABLE 49 USA MANAGED SECURITY SERVICES MARKET, BY VERTICAL, 2016-2025 (USD BILLION)
TABLE 50 CANADA MANAGED SECURITY SERVICES MARKET, BY ORGANIZATION SIZE, 2016-2025 (USD BILLION)
TABLE 51 CANADA MANAGED SECURITY SERVICES MARKET, BY DEPLOYMENT, 2016-2025 (USD BILLION)
TABLE 52 CANADA MANAGED SECURITY SERVICES MARKET, BY VERTICAL, 2016-2025 (USD BILLION)
TABLE 53 MEXICO MANAGED SECURITY SERVICES MARKET, BY ORGANIZATION SIZE, 2016-2025 (USD BILLION)
TABLE 54 MEXICO MANAGED SECURITY SERVICES MARKET, BY DEPLOYMENT, 2016-2025 (USD BILLION)
TABLE 55 MEXICO MANAGED SECURITY SERVICES MARKET, BY VERTICAL, 2016-2025 (USD BILLION)
TABLE 56 EUROPE MANAGED SECURITY SERVICES MARKET, BY COUNTRY, 2016-2025 (USD BILLION)
TABLE 57 EUROPE MANAGED SECURITY MARKET, BY TYPE, 2016-2025 (USD BILLION)
TABLE 58 EUROPE MANAGED SECURITY SERVICES MARKET, BY ORGANIZATION SIZE, 2016-2025 (USD BILLION)
TABLE 59 EUROPE MANAGED SECURITY SERVICES MARKET, BY DEPLOYMENT, 2016-2025 (USD BILLION)
TABLE 60 EUROPE MANAGED SECURITY SERVICES MARKET, BY VERTICAL, 2016-2025 (USD BILLION)
TABLE 61 UK MANAGED SECURITY SERVICES MARKET, BY ORGANIZATION SIZE, 2016-2025 (USD BILLION)
TABLE 62 UK MANAGED SECURITY SERVICES MARKET, BY DEPLOYMENT, 2016-2025 (USD BILLION)
TABLE 63 UK MANAGED SECURITY SERVICES MARKET, BY VERTICAL, 2016-2025 (USD BILLION)
TABLE 64 GERMANY MANAGED SECURITY SERVICES MARKET, BY ORGANIZATION SIZE, 2016-2025 (USD BILLION)
TABLE 65 GERMANY MANAGED SECURITY SERVICES MARKET, BY DEPLOYMENT, 2016-2025 (USD BILLION)
TABLE 66 GERMANY MANAGED SECURITY SERVICES MARKET, BY VERTICAL, 2016-2025 (USD BILLION)
TABLE 67 NETHERLANDS MANAGED SECURITY SERVICES MARKET, BY ORGANIZATION SIZE, 2016-2025 (USD BILLION)
TABLE 68 NETHERLANDS MANAGED SECURITY SERVICES MARKET, BY DEPLOYMENT, 2016-2025 (USD BILLION)
TABLE 69 NETHERLANDS MANAGED SECURITY SERVICES MARKET, BY VERTICAL, 2016-2025 (USD BILLION)
TABLE 70 FRANCE MANAGED SECURITY SERVICES MARKET, BY ORGANIZATION SIZE, 2016-2025 (USD BILLION)
TABLE 71 FRANCE MANAGED SECURITY SERVICES MARKET, BY DEPLOYMENT, 2016-2025 (USD BILLION)
TABLE 72 FRANCE MANAGED SECURITY SERVICES MARKET, BY VERTICAL, 2016-2025 (USD BILLION)
TABLE 73 REST OF EUROPE MANAGED SECURITY SERVICES MARKET, BY ORGANIZATION SIZE, 2016-2025 (USD BILLION)
TABLE 74 REST OF EUROPE MANAGED SECURITY SERVICES MARKET, BY DEPLOYMENT, 2016-2025 (USD BILLION)
TABLE 75 REST OF EUROPE MANAGED SECURITY SERVICES MARKET, BY VERTICAL, 2016-2025 (USD BILLION)
TABLE 76 ASIA-PACIFIC MANAGED SECURITY SERVICES MARKET, BY COUNTRY, 2016-2025 (USD BILLION)
TABLE 77 ASIA-PACIFIC MANAGED SECURITY MARKET, BY TYPE, 2016-2025 (USD BILLION)
TABLE 78 ASIA-PACIFIC MANAGED SECURITY SERVICES MARKET, BY ORGANIZATION SIZE, 2016-2025 (USD BILLION)
TABLE 79 ASIA-PACIFIC MANAGED SECURITY SERVICES MARKET, BY DEPLOYMENT, 2016-2025 (USD BILLION)
TABLE 80 ASIA-PACIFIC MANAGED SECURITY SERVICES MARKET, BY VERTICAL, 2016-2025 (USD BILLION)
TABLE 81 AUSTRALIA MANAGED SECURITY SERVICES MARKET, BY ORGANIZATION SIZE, 2016-2025 (USD BILLION)
TABLE 82 AUSTRALIA MANAGED SECURITY SERVICES MARKET, BY DEPLOYMENT, 2016-2025 (USD BILLION)
TABLE 83 AUSTRALIA MANAGED SECURITY SERVICES MARKET, BY VERTICAL, 2016-2025 (USD BILLION)
TABLE 84 JAPAN MANAGED SECURITY SERVICES MARKET, BY ORGANIZATION SIZE, 2016-2025 (USD BILLION)
TABLE 85 JAPAN MANAGED SECURITY SERVICES MARKET, BY DEPLOYMENT, 2016-2025 (USD BILLION)
TABLE 86 JAPAN MANAGED SECURITY SERVICES MARKET, BY VERTICAL, 2016-2025 (USD BILLION)
TABLE 87 CHINA MANAGED SECURITY SERVICES MARKET, BY ORGANIZATION SIZE, 2016-2025 (USD BILLION)
TABLE 88 CHINA MANAGED SECURITY SERVICES MARKET, BY DEPLOYMENT, 2016-2025 (USD BILLION)
TABLE 89 CHINA MANAGED SECURITY SERVICES MARKET, BY VERTICAL, 2016-2025 (USD BILLION)
TABLE 90 INDIA MANAGED SECURITY SERVICES MARKET, BY ORGANIZATION SIZE, 2016-2025 (USD BILLION)
TABLE 91 INDIA MANAGED SECURITY SERVICES MARKET, BY DEPLOYMENT, 2016-2025 (USD BILLION)
TABLE 92 INDIA MANAGED SECURITY SERVICES MARKET, BY VERTICAL, 2016-2025 (USD BILLION)
TABLE 93 REST OF ASIA-PACIFIC MANAGED SECURITY SERVICES MARKET, BY ORGANIZATION SIZE, 2016-2025 (USD BILLION)
TABLE 94 REST OF ASIA-PACIFIC MANAGED SECURITY SERVICES MARKET, BY DEPLOYMENT, 2016-2025 (USD BILLION)
TABLE 95 REST OF ASIA-PACIFIC MANAGED SECURITY SERVICES MARKET, BY VERTICAL, 2016-2025 (USD BILLION)
TABLE 96 ROW MANAGED SECURITY SERVICES MARKET, BY REGION, 2016-2025 (USD BILLION)
TABLE 97 ROW MANAGED SECURITY SERVICES MARKET, BY TYPE, 2016-2025 (USD BILLION)
TABLE 98 ROW MANAGED SECURITY SERVICES MARKET, BY ORGANIZATION SIZE, 2016-2025 (USD BILLION)
TABLE 99 ROW MANAGED SECURITY SERVICES MARKET, BY DEPLOYMENT, 2016-2025 (USD BILLION)
TABLE 100 ROW MANAGED SECURITY SERVICES MARKET, BY VERTICAL, 2016-2025 (USD BILLION)
TABLE 101 MIDDLE EAST & AFRICA MANAGED SECURITY SERVICES MARKET, BY ORGANIZATION SIZE, 2016-2025 (USD BILLION)
TABLE 102 MIDDLE EAST & AFRICA MANAGED SECURITY SERVICES MARKET, BY DEPLOYMENT, 2016-2025 (USD BILLION)
TABLE 103 MIDDLE EAST & AFRICA MANAGED SECURITY SERVICES MARKET, BY VERTICAL, 2016-2025 (USD BILLION)
TABLE 104 SOUTH AMERICA MANAGED SECURITY SERVICES MARKET, BY ORGANIZATION SIZE, 2016-2025 (USD BILLION)
TABLE 105 SOUTH AMERICA MANAGED SECURITY SERVICES MARKET, BY DEPLOYMENT, 2016-2025 (USD BILLION)
TABLE 106 MIDDLE EAST & AFRICA MANAGED SECURITY SERVICES MARKET, BY VERTICAL, 2016-2025 (USD BILLION)
TABLE 107 PARTNERSHIPS AND COLLABORATIONS
TABLE 108 ACQUISITIONS
TABLE 109 EXPANSIONS
TABLE 110 NEW PRODUCT DEVELOPMENTS
TABLE 111 SECUREWORKS: PRODUCTS, SERVICES, & SOLUTIONS OFFERED
TABLE 112 SECUREWORKS: KEY STRATEGIC DEVELOPMENTS
TABLE 113 IBM: PRODUCTS, SERVICES, & SOLUTIONS OFFERED
TABLE 114 IBM: KEY STRATEGIC DEVELOPMENTS
TABLE 115 VERIZON: PRODUCTS, SERVICES, & SOLUTIONS OFFERED
TABLE 116 VERIZON: KEY STRATEGIC DEVELOPMENTS
TABLE 117 BT: PRODUCTS, SERVICES, & SOLUTIONS OFFERED
TABLE 118 BT: KEY STRATEGIC DEVELOPMENTS
TABLE 119 SYMANTEC: PRODUCTS, SERVICES, & SOLUTIONS OFFERED
TABLE 120 SYMANTEC: KEY STRATEGIC DEVELOPMENTS
TABLE 121 TRUSTWAVE: PRODUCTS, SERVICES, & SOLUTIONS OFFERED
TABLE 122 TRUSTWAVE: KEY STRATEGIC DEVELOPMENTS
TABLE 123 AT&T;: PRODUCTS, SERVICES, & SOLUTIONS OFFERED
TABLE 124 AT&T;: KEY STRATEGIC DEVELOPMENTS
TABLE 125 CENTURYLINK: PRODUCTS, SERVICES, & SOLUTIONS OFFERED
TABLE 126 CENTURYLINK: KEY STRATEGIC DEVELOPMENTS
TABLE 127 WIPRO: PRODUCTS, SERVICES, & SOLUTIONS OFFERED
TABLE 128 WIPRO: KEY STRATEGIC DEVELOPMENT
TABLE 129 ALERT LOGIC: PRODUCTS, SERVICES, & SOLUTIONS OFFERED
TABLE 130 ALERT LOGIC: KEY STRATEGIC DEVELOPMENTS
LIST OF FIGURES
FIGURE 1 MANAGED SECURITY SERVICES MARKET: SEGMENTATION
FIGURE 2 MANAGED SECURITY SERVICES MARKET: REGIONAL SEGMENTATION
FIGURE 3 MANAGED SECURITY SERVICES MARKET: RESEARCH DESIGN
FIGURE 4 MARKET SIZE ESTIMATION METHODOLOGIES: TOP-DOWN & BOTTOM-UP APPROACH
FIGURE 5 MANAGED SECURITY SERVICES MARKET, BY REGION, 2017 (USD BILLION)
FIGURE 6 MANAGED SECURITY SERVICES TO WITNESS INCREASED DEMAND BY 2025
FIGURE 7 HEALTHCARE SEGMENT TO GROW AT HIGHEST RATE DURING FORECAST PERIOD
FIGURE 8 LARGE ENTERPRISES LEAD MANAGED SECURITY SERVICES MARKET
FIGURE 9 ASIA-PACIFIC: MANAGED SECURITY SERVICES MARKET SHARE, BY COUNTRY & VERTICAL, 2017
FIGURE 10 MANAGED SECURITY SERVICES MARKET, BY COUNTRY, 2017
FIGURE 11 MANAGED SECURITY SERVICES: KEY STRATEGIC DEVELOPMENT
FIGURE 12 PORTER’S FIVE FORCES ANALYSIS
FIGURE 13 SUPPLY CHAIN OF MANAGED SECURITY SERVICES MARKET
FIGURE 14 MANAGED SECURITY SERVICES MARKET, BY TYPE, 2016–2025 (USD BILLION)
FIGURE 15 MANAGED SECURITY SERVICES, BY DEPLOYMENT, 2016–2025 (USD BILLION)
FIGURE 16 MANAGED SECURITY MARKET, BY ORGANIZATION SIZE, 2016–2025 (USD BILLION)
FIGURE 17 MANAGED SECURITY SERVICES MARKET, BY VERTICAL, 2016–2025 (USD BILLION)
FIGURE 18 MANAGED SECURITY SERVICE MARKET, BY REGION, 2017 (USD BILLION)
FIGURE 19 ASIA PACIFIC IS ESTIMATED TO LEAD GLOBAL MANAGED SECURITY SERVICES MARKET
FIGURE 20 EUROPE MANAGED SECURITY SERVICES MARKET, BY COUNTRY, 2016-2025 (USD BILLION)
FIGURE 21 ASIA-PACIFIC: MANAGED SECURITY SERVICES MARKET, COUNTRY SNAPSHOT, 2017
FIGURE 22 ASIA-PACIFIC MANAGED SECURITY SERVICES MARKET, BY COUNTRY, 2016-2025 (USD BILLION)
FIGURE 23 ROW MANAGED SECURITY SERVICES MARKET, BY REGION, 2016-2025 (USD BILLION)
FIGURE 24 MANAGED SECURITY SERVICES MARKET OVERVIEW, 2016-2018
FIGURE 25 COMPETITIVE MATRIX: MANAGED SECURITY SERVICES MARKET
FIGURE 26 MANAGED SECURITY SERVICES MARKET SHARE ANALYSIS
FIGURE 27 MANAGED SECURITY SERVICES MARKET: BUSINESS STRATEGIES
FIGURE 28 MANAGED SECURITY SERVICES MARKET: PRODUCT OFFERINGS
FIGURE 29 SECUREWORKS: COMPANY OVERVIEW
FIGURE 30 SECUREWORKS: SWOT ANALYSIS
FIGURE 31 IBM: COMPANY OVERVIEW
FIGURE 32 IBM: SWOT ANALYSIS
FIGURE 33 VERIZON: COMPANY OVERVIEW
FIGURE 34 VERIZON: SWOT ANALYSIS
FIGURE 35 BT: COMPANY OVERVIEW
FIGURE 36 BT: SWOT ANALYSIS
FIGURE 37 SYMANTEC: COMPANY OVERVIEW
FIGURE 38 SYMANTEC: SWOT ANALYSIS
FIGURE 39 TRUSTWAVE: COMPANY OVERVIEW
FIGURE 40 AT&T;: COMPANY OVERVIEW
FIGURE 41 CENTURYLINK: COMPANY OVERVIEW
FIGURE 42 WIPRO: COMPANY OVERVIEW
FIGURE 43 ALERT LOGIC: COMPANY OVERVIEW
Managed security services (MSS) include services offered by the providers to monitor and manage an organization's security requirements. The services are outsourced to a service provider that monitors the organization's security events, processes, security technology, and security-related databases in-house or remotely. These services are delivered through shared services from remote security operations centers (SOCs).
The primary function of managed security services are identity & access management, antivirus/anti-malware management, firewall management, risk & compliance management, vulnerability management, security information & event management, intrusion detection /intrusion prevention management, disaster recovery management, and others.
The managed security services market is expected to grow at a CAGR of 15.2%, to reach USD 73.95 billion by 2025. The market is primarily driven by the factors such as rise in the number of sophisticated cyber threats, stringent government regulations, and lack of skilled security professionals in the organizations. However, unawareness about the cybersecurity amongst the organizations is a primary challenge in front of the MSSPs. The report is segmented by type, organization size, deployment mode, vertical, and region.
In the type segment, the market for managed encryption services is estimated to grow at the highest rate with the rise in concern over critical data loss in the on-premises environment and stringent regulations that enable the adoption of encryption solutions.
The on-cloud deployment segment is estimated grow at the highest rate during the forecast period. This is primarily driven by cost efficiency of cloud based Managed security services. The investments, specifically from SMEs on cloud-based MSS, are estimated to drive the growth of on-cloud deployment segment.
The BFSI industry segment is estimated to have the largest market share in the global managed security services market. The primary challenge in front of organizations is to secure information and maintain the integrity of data with new emerging threats. With the increase of cyber attacks and new regulations, the organizations in the BFSI industry segment heavily invest into the managed security services market.
Managed Security Services Market, By Region, 2017 (USD Billion)
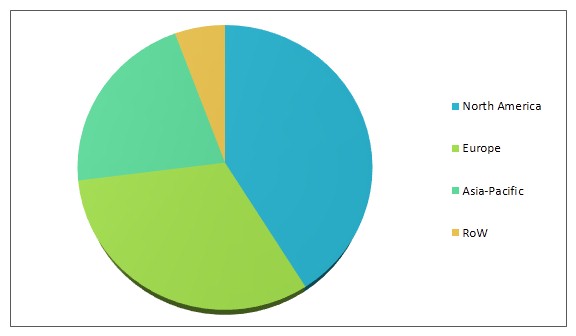
Sources: Secondary Research, Primary Interviews, and Converged Markets Analysis
The North American region is estimated to have the largest market share in global managed security services market. The region has presence of top managed security services vendors, such as IBM, Secure Works Verizon, Symantec, AT&T, and others. In addition, the organizations in this region are highly aware and early adopters of cybersecurity solutions and services. The increase in volume, diversity, and sophistication of cyber threats and severity of direct & indirect implications due to outdated security practices, plus challenges of in-house security capabilities, and adaptation are primary contributors to the North American market.